The MCM team’s analysis has shown that ovarian cancer results were dishomogeneous. We will begin running additional ovarian work units starting September 25th.
Terminology
- Gene signature: A set of genes shown to have a specific role in a disease is called gene signature. When such a signature can predict the presence of a disease, it is called a diagnostic gene signature. When signature relates to survival, it is called prognostic signature.
- Matthews correlation coefficient: A statistical method used to evaluate the performance of a predictive model. It measures the differences between actual values and the predicted ones.
- Probes: Short DNA sequences targeting a small region of a transcript (gene). To make them more specific, probes are organized into probe sets, which are used to detect and quantify the presence of gene sequences through hybridisation due to complementarity between the probe and the target.
Background
The Mapping Cancer Marker project aims to identify biomarkers associated with various cancers. By analyzing millions of data points from patient tissue datasets, we can identify patterns that can enable early detection, identification of high-risk patients, and customization of treatment plans for patients.
In our March update, we outlined our investigation of lung cancer biomarkers conducted by testing multiple signatures in a dataset of tissues belonging to patients who have a history of lung cancer to find any groups of probes that could indicate the patient has early stage lung cancer. As the work on lung cancer signatures continues, we have started to interpret data from ovarian cancer, which we share in this update.
Ovarian cancer analysis
Similarly to our approach with lung cancer, to investigate ovarian cancer biomarkers, we used a collection of multiple datasets with a total of 711 samples. Of the samples, 410 had short survival of under 3 years, and 301 had long survival of over 4 years. Our analyses focused on differentiating patients with long survival from those with a short survival.
Thanks to the help of the WCG volunteers, we were able to test over 160 billion (1.626353x10¹¹) candidate ovarian cancer signatures across several signature sizes. We then considered the signatures with Matthews correlation coefficient in the 99.999 percentile among all signatures of that same size. Figure 1 shows the distribution of biomarkers in the signatures. Count refers to the number of times a probe is present in the top signatures for its size.
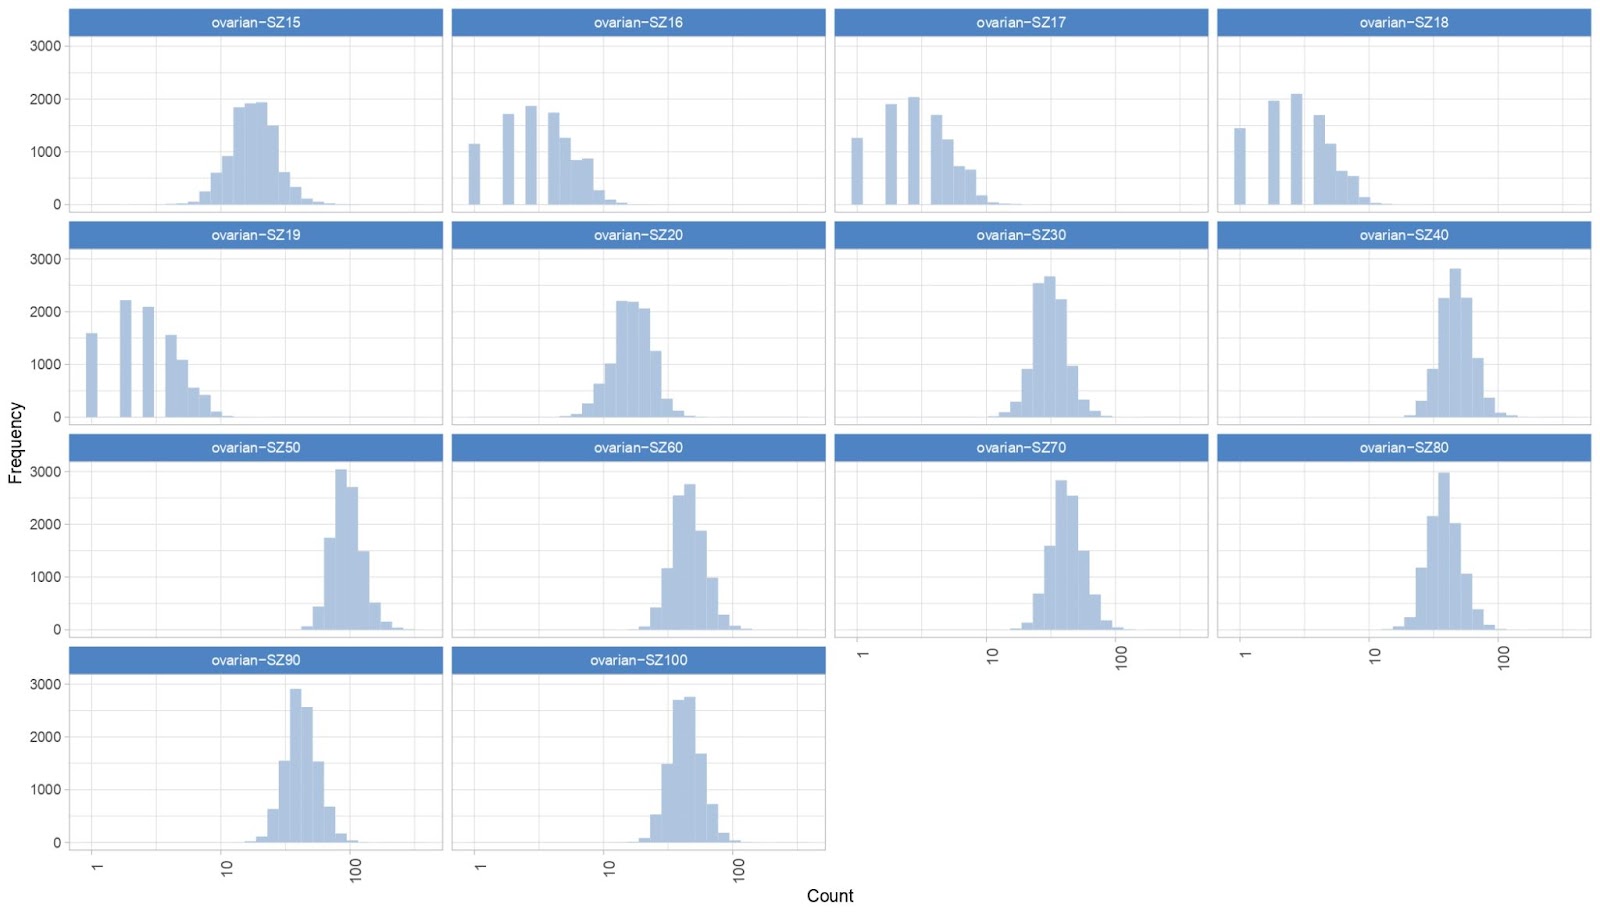
Figure 1. Frequency of each count (i.e., number of times a probe is present) per signature size for ovarian cancer data.
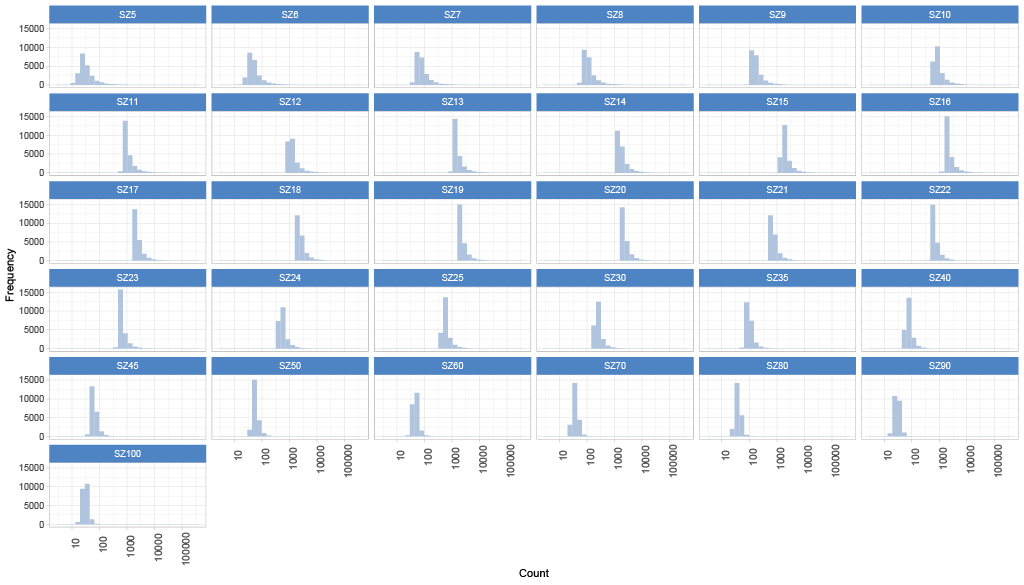
The lung cancer results, shown in Figure 2, follow a normal distribution of biomarkers across the signatures, while results for ovarian cancer (Figure 1) are not normal. Due to this dishomogeneity in ovarian cancer results, we have decided to run additional ovarian cancer work units. These work units will be sent out starting Monday, September 25th and while they are running, sarcoma work units will be paused.
Figure 2. Frequency of each count (i.e., number of times a probe is present) per signature size for lung cancer data.
Thank you for your continued support. If you have any questions or comments, please leave them in this thread for us to answer.