The Chesapeake Bay is suffering: excess nutrient levels in runoff from populated areas are leading to oxygen-depleted "dead zones." The Computing for Sustainable Water project modeled nutrient flows and oxygenation levels in the Bay and predicted the effectiveness of various environmental policies - helping policymakers understand the best and most cost-effective ways of preserving this important economic and ecological region.
Dear World Community Grid Members,
The Computing for Sustainable Water (CFSW) project focused on the Chesapeake Bay watershed in the United States. This is the largest watershed in the US and covers all or part of six states (Virginia, West Virginia, Maryland, Delaware, Pennsylvania, and New York) and Washington, D.C., the nation's capital. The Bay has been under environmental pressure for many years. Previous efforts to address the problem have been unsuccessful. As a result, the size of the Bay's anoxic region (dead zone) continues to affect the native blue crab (callinectes sapidus) population.
The problem is largely a result of nutrient flow (nitrogen and phosphorous) into the Bay that occurs due to agricultural, industrial, and land development activities. Federal, state, and local agencies attempt to control nutrient flow through a set of incentives known as Best Management Practices (BMPs). Entities adopting BMPs typically receive payments. Each BMP is believed to be helpful in some way for controlling nutrient flow. However, the effectiveness of the various BMPs has not been studied on an appropriately large scale. Indeed, there is no clear scientific evidence for the effectiveness of some BMPs that have already been widely adopted.
The Computing for Sustainable Water project conducted a set of large-scale simulation experiments of the impact of BMPs on nutrient flow into the Chesapeake Bay and the resulting environmental health of the Bay. Table 1 lists the 23 BMPs tested in this project. Initially, a simulation run with no BMPs was produced as a baseline case. Then each individual BMP was run separately and compared with the baseline. Table 2 shows the results of these statistical comparisons.
Table 1. Best Management Practices employed in the Chesapeake Bay watershed
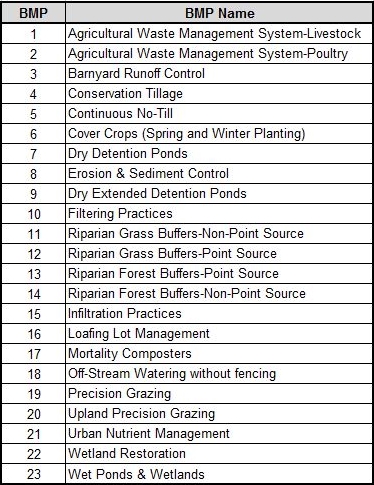
Table 2. Statistical results comparing each BMP to a baseline (no-BMPs) simulation experiment.
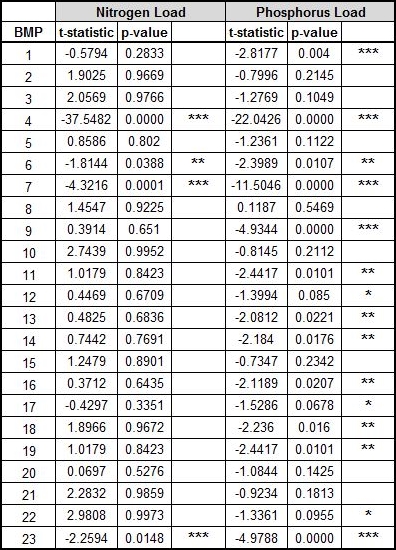
Student's t-tests of individual BMPs compared to base case of no BMPs * = significant at α = 0.10; ** = significant at α = 0.05; *** = significant at α = 0.01
For more information about t-statistic, click here. For more information about p-value, click here.
These results identify several BMPs that are effective in reducing the corresponding nitrogen and phosphorous loads entering the Chesapeake Bay. In particular, BMPs 4, 7, and 23 are highly effective. These results are very informative for policymakers not only in the Chesapeake Bay watershed but globally as well, because many regions of the world experience similar problems and employ similar BMPs.
In all, World Community Grid members facilitated over 19.1 million experiments. These include various combinations of BMPs to discover the possible effectiveness of combinations of BMPs. The analysis of these experiments continues for combinations of BMPs.
We would like to once again express our gratitude to the World Community Grid community. A project of this size and scope simply would not have been possible without your help.