Although work continues, enough data has already been processed to let the Mapping Cancer Markers team begin identifying high-scoring signatures and associating them with particular lung cancer biomarkers. The ultimate goal is to find signatures that distinguish many types of cancer, giving physicians and researchers another tool to improve detection, treatment and patient outcomes.
After a long first stage of exploratory analysis, Mapping Cancer Markers (MCM) began a new, more targeted stage of lung cancer analysis in April 2015. Processing results from the first stage revealed a subset of approximately 1% of the biomarkers that frequently occur in high-scoring signatures. The second stage of the MCM lung cancer study will focus on signatures drawn from this subset of biomarkers.
Among the first research questions we are aiming to answer in the second stage are those about the nature of successful signatures and the reduced signature space. Will the selected subset of biomarkers in the targeted stage perform better at distinguishing lung cancer in tissue samples? Will the effect of signature length (number of biomarkers) on signature performance that we noticed in the exploratory stage also appear in this narrowed signature space? Which patterns of biomarkers characterize the top-performing cancer signatures? Most biological function is achieved by multiple genes (or proteins) participating in a coordinated network or signaling cascade (pathway), so can we discover pairs or larger groups of biomarkers that frequently co-occur in successful signatures? Will these groups of biomarkers correspond to known biological networks, or do successful signatures necessarily draw their members from multiple networks?
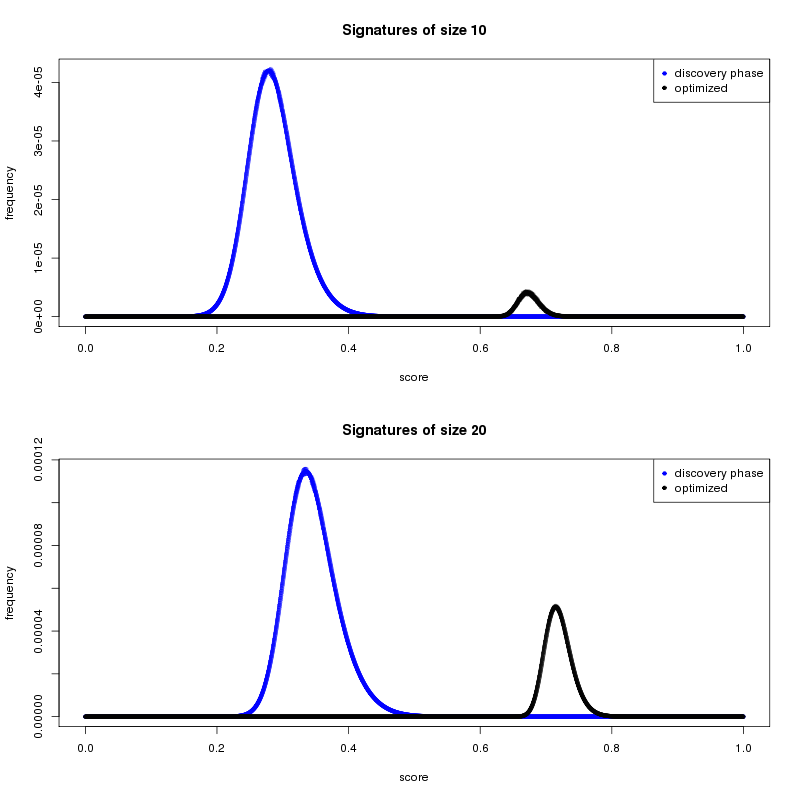
Enough second-stage results have been returned to allow us to start the preliminary analysis. One main goal of the second stage is to discover high-performing cancer signatures. We used results from the first stage to narrow the field of potential biomarkers from 22,000+ to a subset of 223. Figure 1 shows how the average cancer-distinguishing ability of the stage-2 gene signatures has improved considerably, compared to signatures discovered in the initial stage.
Shorter or longer signatures?
One of the questions that the volunteer community might be asking is why we continue to focus on shorter gene signatures when the trend in the data shows that the longer gene signatures are performing better. Despite this trend, a larger gene signature may be more predictive but not always better. One reason is practical. Much of the work in the field of biomarker identification has the ultimate goal of producing a signature that can be translated into a clinical test. Feasibility and economics will play an important role at that stage. The process of moving a research-based result through testing and approval is lengthy and complex, so a 10 gene signature is easier and cheaper to translate than a 65 gene signature. The viability of gene signature sizes has roughly guided how we define our lower and upper size search limits for the MCM project.
Biomarker pairs
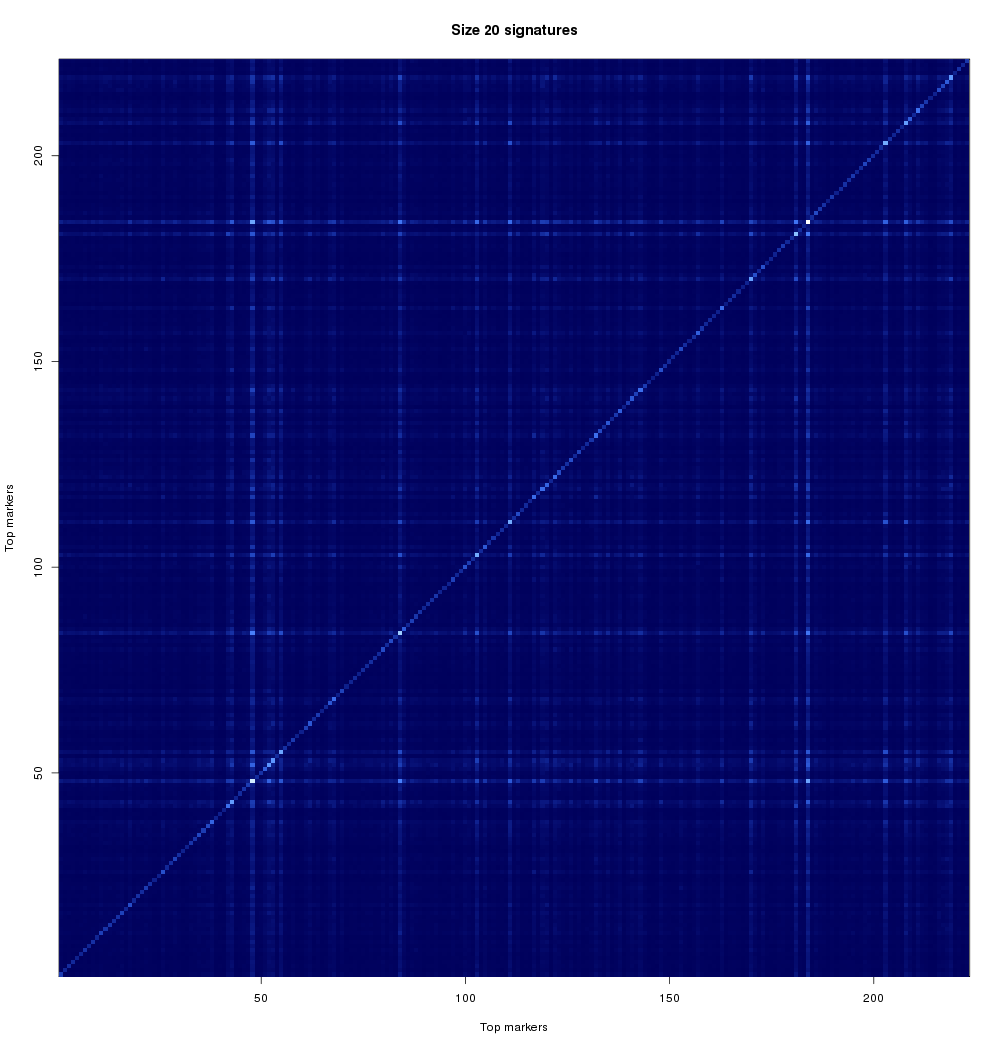
One of our goals in the analysis of gene signatures is to look at smaller combinations of genes, and identify groups of genes that relate to patient outcome in a similar manner (i.e. they may provide alternative choices for the signature). This is important for a variety of reasons. From the analytical side, if we can find two genes that perform almost exactly the same, then a successful gene signature will likely have only one of those. This will help us reduce search space, but also to find alternatives. From the practical side, one of the two (or more) alternatives may be easier to bring to clinical practice. Thus, we aim to find multiple signatures, and characterize them with respect to their relationships. Another reason to look at combinations of genes involves seeing if two genes may have a biological reason for being related. Is this particular cancer affecting two genes at the same time? Is a particular biological pathway compromised? These kinds of questions might explain differences between patients or why certain people respond better to particular therapies. These are questions that are much further down the research path but we wanted to touch on them so that the community is aware of where in the pipeline your contributions have helped and also what still needs to be done. If a pair (or larger group) of genes is related by disease, signatures containing those genes or related biomarkers should perform well. Figure 2 looks at the rate at which stage-2 biomarker pairs co-occur in high-scoring signatures.
A note on run times of research tasks
Some of you may have noticed above-average run times of work units in this new stage of MCM. We are working to make run times more consistent and predictable; however, this job is made more difficult as this stage of the research requires changing work unit designs more frequently than before. The design of new work units will also depend in part on results of earlier second-stage results. Consequently, the turnaround time for benchmarking and calibrating work units may limit our success at stabilizing run times. We trust that our wonderful volunteers will be able to continue contributing results no matter what work units we provide, but we wanted to let you know what to expect. Once again, thank you for making our research possible, and please stay tuned for future announcements!
Recent publications, presentations and media coverage
Media
- The Jurisica lab and the MCM1 project scientists were recently interviewed for a Drug Discovery News article about the difficulties of cancer biomarker discovery and validation: Signs of intelligent biomarkers by Randall C Willis, DDNews.
- Igor was also interviewed for the NewsTalk Radio 1010 in June 2015 about the work on discovering prognostic and predictive cancer signatures.
- World Community Grid was also covered by Genevieve Roberts in The Independent on June 10: In 10 years, 'crowdsourced computing' has changed the world; now it's tackling Ebola
- Navab, R., Strumpf, D., Jurisica, I., Walker, C. G., Gullberg, D., Tsao, M.S. Integrin a11b1 regulates cancer stromal stiffness and promotes tumorigenecity in non-small cell lung cancer, Oncogene, 2015. In press.
- Stewart, E.L., Mascaux, C., Pham, N-A, Sakashita, S., Sykes, J., Kim, L., Yanagawa, N., Allo, G., Ishizawa, K., Wang, D., Zhu, C.Q., Li, M., Ng, C., Liu, N., Pintilie, M., Martin, P., John, T., Jurisica, I., Leighl, N.B., Neel, B.G., Waddell, T.K., Shepherd, F.A., Liu, G., Tsao, M-S. Clinical Utility of Patient Derived Xenografts to Determine Biomarkers of Prognosis and Map Resistance Pathways in EGFR-Mutant Lung Adenocarcinoma, J Clin Oncol, 2015. In press. CJCO/2014/601492.
- Camargo, J. F., Resende, M., Zamel, R., Klement, W., Bhimji, A., Huibner, S., Kumar, D., Humar, A., Jurisica, I., Keshavjee, S., Kaul, R., Husain, S. Potential role of CC chemokine receptor 6 (CCR6) in prediction of late-onset CMV infection following solid organ transplant. Clinical Transplantation, 2015. In press. doi: 10.1111/ctr.12531
- Fortney, K., Griesman, G., Kotlyar, M., Pastrello, C., Angeli, M., Tsao, M.S., Jurisica, I. Prioritizing therapeutics for lung cancer: An integrative meta-analysis of cancer gene signatures and chemogenomic data, PLoS Comp Biol, 11(3): e1004068, 2015.
- Starmans, M.H., Pintilie, M., Chan-Seng-Yue, M., Moon, N.C., Haider, S., Nguyen, F., Lau, S.K., Liu, N., Kasprzyk, A., Wouters, B.G., Der, S.D., Shepherd, F.A., Jurisica, I., Penn, L.Z., Tsao, M.S., Lambin, P., Boutros, P.C. Integrating RAS status into prognostic signatures for adenocarcinomas of the lung. Clin Cancer Res, 21(6): 1477-86, 2015.
- Wong, S. W. H., Cercone, N., Jurisica, I. Comparative network analysis via differential graphlet communities, Special Issue of Proteomics dedicated to Signal Transduction, Proteomics, 15(2-3):608-17, 2015. E-pub 2014/10/07. doi: 10.1002/pmic.201400233
- Hoeng J, Peitsch MC, Meyer, P. and Jurisica, I. Where are we at regarding Species Translation? A review of the sbv IMPROVER Challenge, Bioinformatics, 31(4):451-452, 2015.
- Keynote: Life of an orphan protein, Symposium on Computational Biology, eScience approaches for biomedical data analysis, University of Southern Denmark, Odense, June 10-12
- Invited presentation: High-performance computing in integrative cancer informatics. Fathoming cancer by data-driven medicine, Advanced Computing and Analytics in Medical Research Symposium, University of Ottawa, May 11-12.
- Invited presentation: Scalable visual data mining.
- HPC and “big data” in integrative cancer informatics. OCE Discovery Conference, the Metro Toronto Convention Centre, April 28.
- Invited presentation: High-performance computing in integrative cancer informatics. Challenges and opportunities in intelligent molecular medicine, Systems Biology Ireland Seminar Series, University College Dublin, The College of Health Sciences, Dublin, Ireland, March 6
- Keynote presentation: Integrative cancer informatics - moving personalized medicine to preventive interventions, Cancer Care Ontario Workshop - PREVENTION INTERVENTION STUDIES TO IMPROVE THE HEALTH OF ADULT CANCER SURVIVORS.
- Scalable visual data mining video and demo, Compute Ontario highlight at OCE Discovery Conference, Toronto, April 27-28
- Scalable visual data mining video, High Performance Computing Conference, Montreal, June
Related Articles
- Working to detect lung and ovarian cancers before they start
- Mapping Cancer Markers Begins Analyzing Lung and Ovarian Cancer Data
- Mapping Cancer Markers Team Analyzes Lung Cancer Data
- Sarcoma Dataset Coming Soon to Mapping Cancer Markers Project