In this comprehensive update, the Mapping Cancer Markers team explains how they are determining which genes and gene signatures carry the greatest promise for lung cancer diagnosis. They also introduce the next type of cancer--sarcoma--to be added soon to the project.
The Mapping Cancer Markers (MCM) project continues to process work units for the ovarian cancer dataset. As we accumulate these outcomes, we continue to analyze MCM results from the lung cancer dataset. In this update, we discuss preliminary findings from this analysis. In addition, we introduce the sarcoma dataset that will be our focus in the next stage.
Patterns of gene-family biomarkers in lung cancer
In cancer, and human biology in general, multiple groups of biomarkers (genes, protein, microRNAs, etc.) can have similar patterns of activity and thus clinical utility, helping diagnosis, prognosis or predicting treatment outcome. For each cancer subtype, one could find large number of such groups of biomarkers, each having similar predictive power; yet current statistical and AI-based methods identify only one from a given data set.
We have two primary goals in MCM: 1) to find good groups of biomarkers for the cancers we study, and 2) to identify how and why these biomarkers form useful groups, so we can build a heuristic approach that will find such groups for any disease without needing months of computation on World Community Grid. The first goal will give us not only information that after validation may be useful in clinical practice, but importantly, it will generate data that we will use to validate our heuristics.
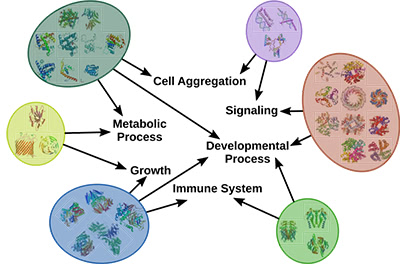
Illustration 1: Proteins group by similar interactions and similar biological functions.
Multiple groups of biomarkers exist primarily due to the redundancy and complex wiring of the biological system. For example, the highly interconnected human protein-protein interaction network enables us to see how individual proteins perform diverse molecular functions and together contribute to a specific biological process, as shown above in Illustration 1. Many of these interactions change between healthy and disease states, which in turn affects the functions these proteins carry. Through these analyses, we aim to build models of these processes that in turn could be used to design new therapeutic approaches.
Two specific groups of biomarkers may appear different from each other, yet perform equivalently because the proteins perform similar molecular functions. However, using these groups of biomarkers for patient stratification may not be straightforward. Groups of biomarkers often do not validate in new patient cohorts or when measured by different biological assays, and there are thousands of possible combinations to consider. Some groups of biomarkers may have all reagents available while others may need to be develop (or be more expensive); they may also have different robustness, sensitivity and accuracy, affecting their potential as clinically useful biomarkers.
At the present time, there is no effective approach to find all good groups of biomarkers necessary to achieve the defined goal, such as accurately predicting patient risk or response to treatment.
The first goal of the Mapping Cancer Markers project is to gain a deeper understanding of the “rules” of why and how proteins interact and can be combined to form a group of biomarkers, which is essential to understanding their role and applicability. Therefore, we are using the unique computational resource of World Community Grid to systematically survey the landscape of useful groups of biomarkers for multiple cancers and purposes (diagnosis and prognosis). Thereby, we established a benchmark for cancer gene biomarker identification and validation. Simultaneously, we are applying unsupervised learning methods such as hierarchical clustering to proteins that group by predictive power and biological function.
The combination of this clustering and the World Community Grid patterns enables us to identify generalized gene clusters that provide deeper insights to the molecular background of cancers, and give rise to more reliable groups of gene biomarkers for cancer detection and prognosis.
Currently, we are focusing on the first-phase results from the lung cancer dataset, which focused on a systematic exploration of the entire space of potential fixed-length groups of biomarkers.
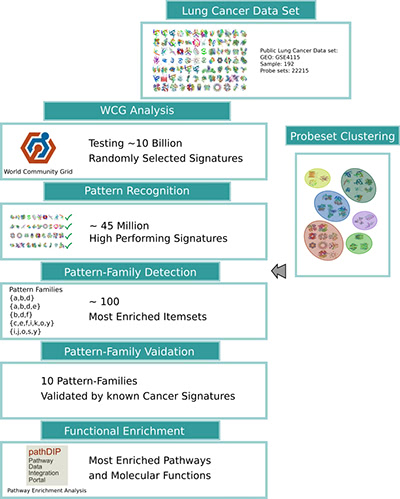
Illustration 2: Workflow of the MCM-gene-pattern-family search. The results of the World Community Grid analysis combined with the unsupervised clustering of genes identifies a set of gene-pattern-families, generalizing the groups of biomarkers. Finally, the results are evaluated using known cancer biomarkers and by using functional annotations, such as signaling pathways, gene ontology function and processes.
As depicted above in Illustration 2, World Community Grid computed about 10 billion randomly selected groups of biomarkers, to help us understand the distribution of which group sizes and biomarker combinations perform well, which in turn we will use to validate heuristic approaches. Analysis showed that about 45 million groups of biomarkers had a high predictive power and passed the quality threshold. This evaluation gives us a detailed and systematic picture of which genes and gene groups carry the most valuable information for lung cancer diagnosis. Adding pathway and protein interaction network data enables us to further interpret and fathom how and why these groups of biomarkers perform well, and what processes and functions these proteins carry.
Simultaneously, we used the described lung cancer data to discover groups of similar genes. We assume that these genes or the encoded proteins fulfill similar biological functions or are involved in the same molecular processes.
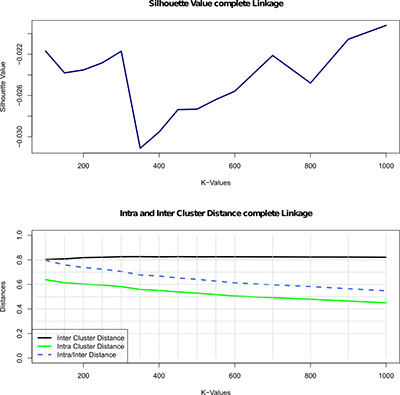
Illustration 3: Evaluation of the hierarchical clustering of the lung cancer data, using the complete linkage parameter, for different numbers of groups indicated by the K-values (100 to 1000). The first plot shows the silhouette value - a quality metric in this clustering, i.e., measure of how well each object relates to its cluster compared to other clusters. The second plot depicts the inter- and intra-cluster distance and the ratio of intra/inter cluster distance.
To find the appropriate clustering algorithms and the right number of gene groups (clusters) we use different measures to evaluate the quality of each of the individual clustering. For instance, Illustration 3 (above) shows the results of the evaluation of the hierarchical clustering for different numbers of clusters. To evaluate clustering quality, we used silhouette value (method for assessing consistency within clusters of data, i.e., measure of how well each object relates to its own cluster compared to other clusters). A high silhouette value indicates good clustering configuration, and the figure shows a large increase in the silhouette value at 700 gene groups. Since this indicates a significant increase in quality, we subsequently select this clustering for further analysis.
Not all combinations of biological functions or the lack of it will lead to cancer development and will be biologically important. In the next step, we apply a statistical search to investigate which combinations of clusters are most common among the well-preforming biomarkers, and therefore result in gene groups or pattern families. Since some gene-pattern-families are likely to occur even at random, we use enrichment analysis to ensure the selection only contains families that occur significantly more often than random.
In the subsequent step we validated the selected generalized gene-pattern-families using an independent set of 28 lung cancer data sets. Each of these studies report one or several groups of biomarkers of up- or down-regulated genes that are indicative for lung cancer.
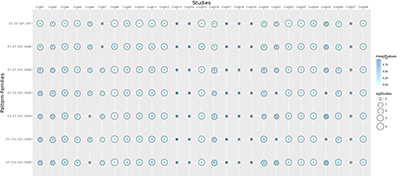
Illustration 4: Shown is a selection of high performing pattern families and how they are supported by 28 previously published gene signatures. Each circle in the figure indicates the strength of the support: The size of the circle represents the number of clusters in the family that where found significantly more often in the signature of this study. The color of the circle indicates the average significance calculated for all clusters in the pattern-family.
Illustration 4 depicts a selection of the most prevalent pattern families and the studies that support them. Each circle in the figure indicates the strength of the support: The size of the circle represents the number of clusters in the family that where found significantly more often in the biomarker of this study. The color of the circle indicates the average significance calculated for all clusters in the pattern-family.
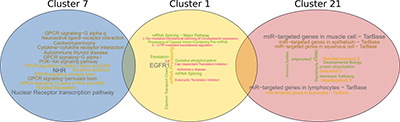
Illustration 5: One of the most frequent gene-pattern-families, is a combination of cluster 1, 7 and 21. We annotated each cluster with pathways using pathDIP and visualized it using word clouds (the larger the word/phrase, the most frequently it occurs).
Finally, we annotated the most effective gene-pattern-families and their gene clusters with molecular functions and pathways that the genes or corresponding proteins are involved in. Illustration 5 shows an example for such a gene-pattern-family that comprises gene-clusters 7, 1 and 21.
The word cloud visualization indicates that cluster 7 is involved in pathways related to GPCRs (G protein–coupled receptor) and NHRs (nuclear hormone receptors). In contrast, the genes in cluster 1 are highly enriched in EGFR1 (epidermal growth factor receptor) as well as translational regulation pathways. Mutations affecting the expression of EGFR1, a transmembrane protein, have shown to result in different types of cancer, and in particular lung cancer (as we have shown earlier, e.g., (Petschnigg et al., J Mol Biol 2017; Petschnigg et al., Nat Methods 2014)). The aberrations increase the kinase activity of EGFR1, leading to hyperactivation of downstream pro-survival signaling pathways and a subsequent uncontrolled cell division. The discovery of EGFR1 initiated the development of therapeutic approaches against various cancer types including lung cancer. The third group of genes are common targets of microRNAs. Cluster 21 indicates strong involvement with microRNAs, as we and others have shown before (Tokar et al., Oncotarget 2018; Becker-Santos et al., J Pathology, 2016; Cinegaglia et al., Oncotarget 2016).
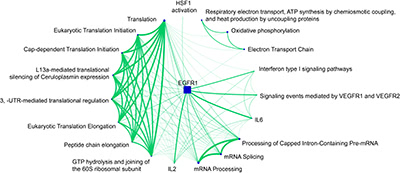
Illustration 6: Evaluation of enriched pathways for cluster 1. Here we used our publicly available pathway enrichment analysis portal pathDIP (Rahmati et al., NAR 2017). The network was generated with our network visualization and analysis tool NAViGaTOR 3 (http://ophid.utoronto.ca/navigator).
The final illustration evaluates the 20 most significantly enriched pathways for cluster 1. The size of the pathway nodes corresponds to the number of involved genes, and the width of the edges corresponds the number genes of overlapping between pathways. One can see that all pathways involved in translation are highly overlapping. mRNA-related pathways form another highly connected component in the graph. The EGFR1 pathway is strongly overlapping with many of the other pathways, indicating that genes that are affected by those pathways are involved in a similar molecular mechanism.
Sarcoma
After lung and ovarian cancers, next we will focus on sarcoma. Sarcomas are a heterogeneous group of malignant tumors that are relatively rare. They are typically categorized according to the morphology and type of connective tissues that they arise in, including fat, muscle, blood vessels, deep skin tissues, nerves, bones and cartilage, which comprises less than 10% of all malignancies (Jain 2010). Sarcomas can occur anywhere in the human body, from head to foot, can develop in patients of any age including children, and often vary in aggressiveness, even within the same organ or tissue subtype (Honore 2015). This suggests that a histological description by organ and tissue type is neither sufficient for categorization of the disease nor does it help in selecting the most optimal treatment.
Diagnosing sarcomas poses a particular dilemma, not only due to their rarity, but also due to their diversity, with more than 70 histological subtypes, and our insufficient understanding of the molecular characteristics of these subtypes (Jain 2010).
Therefore, recent research studies focused on molecular classifications of sarcomas based on genetic alterations, such as fusion genes or oncogenic mutations. While research achieved major developments in local control/limb salvage, the survival rate for “high-risk” soft tissue sarcomas (STSs) has not improved significantly, especially in patients with a large, deep, high-grade sarcoma (stage III) (Kane III 2018).
For these reasons, in the next phase of World Community Grid analysis, we will focus on the evaluation of the genomic background of sarcoma. We will utilize different sequencing information and technologies to gain a broader knowledge between the different levels of genetic aberrations and the regulational implications. We will provide a more detailed description of the data and the incentives in the next update.
- Petschnigg J, Kotlyar M, Blair L, Jurisica I, Stagljar I, and Ketteler R, Systematic identification of oncogenic EGFR interaction partners, J Mol Biol, 429(2): 280-294, 2017.
- Petschnigg, J., Groisman, B., Kotlyar, M., Taipale, M., Zheng, Y., Kurat, C., Sayad, A., Sierra, J., Mattiazzi Usaj, M., Snider, J., Nachman, A., Krykbaeva, I., Tsao, M.S., Moffat, J., Pawson, T., Lindquist, S., Jurisica, I., Stagljar, I. Mammalian Membrane Two-Hybrid assay (MaMTH): a novel split-ubiquitin two-hybrid tool for functional investigation of signaling pathways in human cells; Nat Methods, 11(5):585-92, 2014.
- Rahmati, S., Abovsky, M., Pastrello, C., Jurisica, I. pathDIP: An annotated resource for known and predicted human gene-pathway associations and pathway enrichment analysis. Nucl Acids Res, 45(D1): D419-D426, 2017.
- Kane, John M., et al. "Correlation of High-Risk Soft Tissue Sarcoma Biomarker Expression Patterns with Outcome following Neoadjuvant Chemoradiation." Sarcoma 2018 (2018).
- Jain, Shilpa, et al. "Molecular classification of soft tissue sarcomas and its clinical applications." International journal of clinical and experimental pathology 3.4 (2010): 416.
- Honore, C., et al. "Soft tissue sarcoma in France in 2015: epidemiology, classification and organization of clinical care." Journal of visceral surgery 152.4 (2015): 223-230.
- Tokar T, Pastrello C, Ramnarine VR, Zhu CQ, Craddock KJ, Pikor L, Vucic EA, Vary S, Shepherd FA, Tsao MS, Lam WL, Jurisica Differentially expressed microRNAs in lung adenocarcinoma invert effects of copy number aberrations of prognostic genes. Oncotarget. 9(10):9137-9155, 2018
- Becker-Santos, D.D., Thu, K.L, English, J.C., Pikor, L.A., Chari, R., Lonergan, K.M., Martinez, V.D., Zhang, M., Vucic, E.A., Luk, M.T.Y., Carraro, A., Korbelik, J., Piga, D., Lhomme, N.M., Tsay, M.J., Yee, J., MacAulay, C.E., Lockwood, W.W., Robinson, W.P., Jurisica, I., Lam, W.L., Developmental transcription factor NFIB is a putative target of oncofetal miRNAs and is associated with tumour aggressiveness in lung adenocarcinoma, J Pathology, 240(2):161-72, 2016.
- Cinegaglia, N.C., Andrade, S.C.S., Tokar, T., Pinheiro, M., Severino, F. E., Oliveira, R. A., Hasimoto, E. N., Cataneo, D. C., Cataneo, A.J.M., Defaveri, J., Souza, C.P., Marques, M.M.C, Carvalho, R. F., Coutinho, L.L., Gross, J.L., Rogatto, S.R., Lam, W.L., Jurisica, I., Reis, P.P. Integrative transcriptome analysis identifies deregulated microRNA-transcription factor networks in lung, adenocarcinoma, Oncotarget, 7(20): 28920-34, 2016.
Other news
We have secured a major funding from Ontario Government for our research: The Next Generation Signalling Biology Platform. The main goal of the project is developing novel integrated analytical platform and workflow for precision medicine. This project will create an internationally accessible resource that unifies different types of biological data, including personal health information—unlocking its full potential and making it more usable for research across the health continuum: from genes and proteins to pathways, drugs and humans.
We have also published papers describing several tools, portals and applications with our collaborators. Below we list those most related directly or indirectly to work on World Community Grid:
- Wong, S., Pastrello, C., Kotlyar, M., Faloutsos, C., Jurisica, I. SDREGION: Fast spotting of changing communities in biological networks. ACM KDD Proceedings, 2018. In press. BMC Cancer, 18(1):408, 2018.
- Kotlyar, M., Pastrello, C., Rossos, A., Jurisica, I. Protein-protein interaction databases. Eds. Cannataro, M. et al. Encyclopedia of Bioinformatics and Computational Biology, 81, Elsevier. In press. doi.org/10.1016/B978-0-12-811414-8.20495-1
- Rahmati, S., Pastrello, C., Rossos, A., Jurisica, I. Two Decades of Biological Pathway Databases: Results and Challenges, Eds. Cannataro, M. et al. Encyclopedia of Bioinformatics and Computational Biology, 81, Elsevier. In press.
- Hauschild, AC, Pastrello, C., Rossos, A., Jurisica, I. Visualization of Biomedical Networks, Eds. Cannataro, M. et al. Encyclopedia of Bioinformatics and Computational Biology, 81, Elsevier. In press.
- Sivade Dumousseau M, Alonso-López D, Ammari M, Bradley G, Campbell NH, Ceol A, Cesareni G, Combe C, De Las Rivas J, Del-Toro N, Heimbach J, Hermjakob H, Jurisica I, Koch M, Licata L, Lovering RC, Lynn DJ, Meldal BHM, Micklem G, Panni S, Porras P, Ricard-Blum S, Roechert B, Salwinski L, Shrivastava A, Sullivan J, Thierry-Mieg N, Yehudi Y, Van Roey K, Orchard S. Encompassing new use cases - level 3.0 of the HUPO-PSI format for molecular interactions. BMC Bioinformatics, 19(1):134, 2018.
- Minatel BC, Martinez VD, Ng KW, Sage AP, Tokar T, Marshall EA, Anderson C, Enfield KSS, Stewart GL, Reis PP, Jurisica I, Lam WL., Large-scale discovery of previously undetected microRNAs specific to human liver. Hum Genomics, 12(1):16, 2018.
- Tokar T, Pastrello C, Ramnarine VR, Zhu CQ, Craddock KJ, Pikor L, Vucic EA, Vary S, Shepherd FA, Tsao MS, Lam WL, Jurisica, I. Differentially expressed microRNAs in lung adenocarcinoma invert effects of copy number aberrations of prognostic genes. Oncotarget. 9(10):9137-9155, 2018.
- Paulitti A, Corallo D, Andreuzzi E, Bizzotto D, Marastoni S, Pellicani R, Tarticchio G, Pastrello C, Jurisica I, Ligresti G, Bucciotti F, Doliana R, Colladel R, Braghetta P, Di Silvestre A, Bressan G, Colombatti A, Bonaldo P, Mongiat M. Matricellular EMILIN2 protein ablation ca 1 uses defective vascularization due to impaired EGFR-dependent IL-8 production, Oncogene, Feb 27. doi: 10.1038/s41388-017-0107-x. [Epub ahead of print] 2018.
- Tokar, T., Pastrello, C., Rossos, A., Abovsky, M., Hauschild, A.C., Tsay, M., Lu, R., Jurisica. I. mirDIP 4.1 – Integrative database of human microRNA target predictions, Nucl Acids Res, D1(46): D360-D370, 2018.
- Kotlyar M., Pastrello, C., Rossos, A., Jurisica, I., Prediction of protein-protein interactions, Current Protocols in Bioinf, 60, 8.2.1–8.2.14., 2017.
- Singh, M., Venugopal, C., Tokar, T., Brown, K.B., McFarlane, N., Bakhshinyan, D., Vijayakumar, T., Manoranjan, B., Mahendram, S., Vora, P., Qazi, M., Dhillon, M., Tong, A., Durrer, K., Murty, N., Hallet, R., Hassell, J.A., Kaplan, D., Jurisica, I., Cutz, J-C., Moffat, J., Singh, D.K., RNAi screen identifies essential regulators of human brain metastasis initiating cells, Acta Neuropathologica, 134(6):923-940, 2017.
Thank you
This work would not be possible without the participation of World Community Grid Members. Thank you for generously contributing CPU cycles, and for your interest in this and other World Community Grid projects.
Related Articles
- One step closer to identifying lung cancer biomarkers
- Working to detect lung and ovarian cancers before they start
- Mapping Cancer Markers Begins Analyzing Lung and Ovarian Cancer Data
- Mapping Cancer Markers Team Analyzes Lung Cancer Data
- New Facility and Expanded Plans for the Mapping Cancer Markers Research Team
- Mapping Cancer Markers Researchers Analyzing Lung Cancer Data